
Did you know that companies that use data-driven marketing are six times more likely to be profitable than those that don’t?
If you’re a marketer or business owner, then it’s no secret that data is a key asset in your toolkit. It helps you understand how customers buy products, what they like about your brand, and where you can improve your current digital marketing strategies. But if you’re not familiar with statistics or marketing analytics, then all of this data might seem overwhelming—and ultimately useless.
In this guide, my goal is not just to tell you about the theory of statistics but rather define real-life examples of how to use statistics in your marketing. We’ll show you how to leverage data to increase your profits and outperform your competition.
So, whether you’re a beginner or an intermediate marketer, this guide will help you harness the power of data-driven marketing and take your marketing to the next level.
What is Statistics?
Have you ever wondered how companies like Google and Facebook use data to personalize ads and increase engagement? The answer is statistics.
Statistics is a powerful field of mathematics that involves collecting, organizing, analyzing, and interpreting data to gain insights into customer behavior and preferences. It enables us to uncover patterns, summarize evidence, and conduct experiments, which allows us to gain insights into the past, present, and future. For marketers, a solid grasp of the basics of statistics is crucial because the key to marketing success lies in the ability to analyze large amounts of data. By understanding the principles of statistics, marketers can harness the power of data to make informed decisions, optimize campaigns, and drive business growth with a variety of marketing analytics tools like A/B testing, customer segmentation, and conversion attribution, to name a few.
Statistics is usually separated into 2 major groups: Descriptive and Inferential.
Descriptive Statistics: provide a snapshot of the data at hand and focus on describing the characteristics or features of a dataset. The main features or characteristics described in this stage include measures of central tendency (mean), variability (standard deviation), distribution shape (skewness), and variable relationship (correlation). Descriptive statistics ultimately helps you visualize your data’s distribution by plotting frequency histograms or boxplots.
Inferential Statistics use sampled data to make generalizations about larger populations based on representative samples from those populations.
The main difference between the two types of statistics is that descriptive statistics describe data, while inferential statistics make conclusions about data.
What is Descriptive Statistics?
Descriptive statistics is a branch of statistics that focuses on the analysis and interpretation of data. Its primary goal is to summarize and describe the key features of a dataset and is often categorized into 4 main groups central tendency, variability, distribution, and relationship.
Central Tendency
- Purpose: provide information about the average value of the data.
- Measurements:
- Mean – also known as the average, is calculated by adding up all the values in a dataset and then dividing the sum by the number of values.
- Median – the middle value in a dataset when the values are arranged in order from lowest to highest (or highest to lowest).
- Mode – the value that appears most frequently in a dataset.
Examples of Central Tendency in Marketing
Let’s say you’re a marketer for an e-commerce company and want to understand your customers’ average order value (AOV). To calculate the AOV, you can use the mean, which is a measure of central tendency. First, you would divide the total revenue generated from all purchases by the total number of orders. This will give you the mean or average order value.
Once you have the AOV, you can use this information to optimize your marketing campaigns. For example, you may want to increase the AOV by offering discounts for customers who spend above a certain threshold or by promoting bundles of products that complement each other. By understanding the central tendency of your data, you can make informed decisions that help you achieve your marketing goals.
Another central tendency measure that may be relevant to marketers is the mode. For example, the mode could identify the most commonly purchased item among a group of customers, allowing you to tailor your marketing efforts to highlight that item or create promotions around it.
Variability
- Purpose: provide information about the spread or dispersion of the data.
- Measurement:
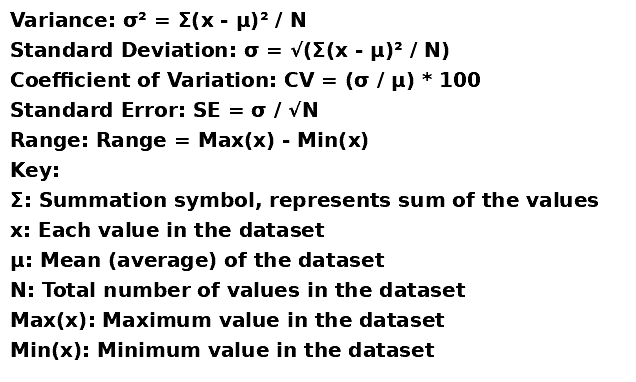
- Variance – measures how spread out the data in a set is.
- Standard Deviation – measure of how much each value in the set differs from the mean, on average
- Coefficient of variation – used to compare the degree of variation between datasets that have different means.
- Standard Error – tells you how much the sample mean (average) of a set of data is likely to differ from the true population mean
- Range – measures the difference between the highest and lowest values in a dataset
Variability Formulas
Examples of Variability in Marketing
A marketer might want to analyze the variance of sales data for two different products, say product A and product B, in order to determine which product is more consistent in its sales.
Let’s say that product A has an average monthly sales revenue of $10,000 with a variance of $1,000, while product B has an average monthly sales revenue of $10,000 with a variance of $3,000. In this case, we can see that the variance for product B is higher, which indicates that the sales revenue for this product is more spread out or diverse compared to product A.
This information could be useful for the marketer in deciding which product to focus on or promote more heavily. For instance, they may decide to allocate more marketing resources to product B in order to stabilize and increase its sales revenue, or they may choose to continue focusing on product A since it has a more consistent sales performance. By using variance measures in this way, marketers can make more informed decisions about their strategies and tactics based on the degree of variability in their sales or other data sets.
Distribution Shape
- Purpose: provide information about the shape of the data.
- Measurement:
- Skewness – tells us if the data is more concentrated on one side of the mean or the other
- Kurtosis – tells us how much data is clustered around the mean and how much is in the tails of the distribution
Examples of Distribution in Marketing
Let’s say a marketing team wants to analyze the distribution of purchase amounts for their product to see if they can find any insights that may be useful for their future campaigns.
After collecting the data, they plot the distribution of purchase amounts and calculate the skewness and kurtosis. They find that the distribution is positively skewed, meaning there are more low purchase amounts and fewer high purchase amounts. The kurtosis is high, indicating a sharper peak and more values in the tails compared to a normal distribution.
Based on these measures, the marketing team may focus their future campaigns on attracting more customers willing to make higher purchases. They may consider creating targeted ads for customers who have made high purchases in the past or offering promotions for higher purchase amounts. They may also consider analyzing the data further to identify any patterns or trends in their customers’ purchase behavior, such as time of day or day of the week, and tailor their campaigns accordingly.
By understanding the shape of the distribution of purchase amounts, the marketing team can gain valuable insights into the behavior of their customers and make informed decisions about how to best target and attract them in the future.
Relationship
- Purpose: Measure the relationship between 2 datapoints
- Measurement:
- Covariance – measures how much two variables vary together, providing information about the direction of the relationship (whether it’s positive or negative) and the strength of the relationship
- Correlation – measures the degree to which two variables are related to each other, providing information about the strength and direction of the relationship. It is a standardized measure that ranges from -1 to 1, where a value of -1 indicates a perfectly negative correlation, 0 indicates no correlation, and 1 indicates a perfectly positive correlation.
Examples of Relationship Analysis in Marketing
Let’s say a company wants to determine if there is a relationship between customer satisfaction and repeat purchases. They can use correlation analysis to measure the strength and direction of the relationship between these two variables.
To do this, they would collect data on customer satisfaction ratings and repeat purchase behavior over a certain period of time. They could then calculate the correlation coefficient between these two variables to determine if there is a positive or negative correlation between them.
If the correlation coefficient is positive, it would indicate that as customer satisfaction increases, the likelihood of repeat purchases also increases. This information can be used to inform marketing strategies that aim to improve customer satisfaction, such as improving customer service or offering promotions to incentivize repeat purchases.
On the other hand, if the correlation coefficient is negative, it would indicate that as customer satisfaction increases, the likelihood of repeat purchases decreases. This would suggest that the company needs to re-evaluate its marketing strategies to identify why customers are not returning to make repeat purchases.
What is Inferential Statistics?
Inferential Statistics is a branch of statistics that provides us with tools and techniques to make estimations or predictions about a population based on a sample of data drawn from it. Unlike descriptive statistics, which merely describe the observed data, inferential statistics delve deeper, enabling us to infer trends, make forecasts, and form insights about a larger population. It is a cornerstone of data-driven decision-making and is widely used across various fields, with marketing being a significant one.
Conducting an Inferential Test
Inferential statistics consists of various methods to conduct tests and derive insights. The three main ways are Hypothesis Testing, Confidence Intervals, and Regression Analysis.
- Hypothesis Testing: A statistical method that helps in decision-making using data. It involves making an initial claim (null hypothesis), collecting data relevant to the claim, and then determining whether the collected data provides enough evidence to reject the null hypothesis.
- Confidence Intervals: Is a estimated range of values, which is likely to include an unknown population parameter. The interval has an associated confidence level that quantifies the level of confidence that the unknown population parameter lies within the interval.
- Regression Analysis: A statistical process for estimating the relationships among variables. It includes techniques for modeling and analyzing several variables when the focus is on the relationship between a dependent variable and one or more independent variables.
Using Hypothesis Testing in Marketing
A marketer might want to test the hypothesis that a new advertising campaign will increase product sales. The null hypothesis (H0) could be “The new advertising campaign will have no effect on sales,” while the alternative hypothesis (H1) is “The new advertising campaign will increase sales.” After running the campaign for some time and collecting sales data, they can use hypothesis testing to determine if there’s enough evidence to reject the null hypothesis and conclude that the campaign has had a positive effect on sales.
Using Confidence Internvals in Marketing
Suppose a marketer wants to estimate the average age of their product’s users. They might take a random sample of users and calculate the sample mean age and standard deviation. Using these statistics, they could construct a 95% confidence interval for the mean age of all their product’s users. This interval estimate provides a range of values that, statistically, should contain the true mean age of all users.
Using Regressions in Marketing
Marketers often use regression analysis to understand the impact of advertising spending on sales. For example, a marketer might want to know how much of an increase in sales could be expected for each thousand dollars spent on an advertising campaign. By using historical data on advertising spend and sales, a regression analysis could be used to quantify the relationship between these variables and to make predictions about future sales.
Harnessing the Full Potential of Data
Take control of your marketing campaigns by mastering the power of statistics and start making informed decisions and optimizing your campaigns. Remember, statistics isn’t just about numbers – it’s a powerful tool that helps you understand customers’ behavior and preferences. Businesses that use data are six times more likely to be profitable than those that don’t. So don’t be intimidated by the numbers – embrace them as a tool to help you achieve your marketing goals. With the right statistical knowledge and techniques at your disposal, you can take your marketing campaigns to the next level and drive measurable results for your business.
Want to gain a competitive edge with data-driven marketing? Our team of experts is here to help. With a free consultation, we can help you unlock the full potential of your marketing data and drive measurable results for your business. But don’t wait – click here to schedule your personalized consultation today and start seeing the benefits of data-driven marketing for yourself.